In a traditionl application, telemetry data is usually used to give developers quick feedback of how a change impacts the production environment.
This way, by monitoring the telemetry data closely, a new change pushed to the application that causes unforseen problems in production is often caught and fixed before any customer is visibly impacted.
The nano-node provides telemetry data aswell.
I created a dashboard that monitors the telemetry data provided by the top#20 representatives. This way we have a tool that leverages the available information so we can proactively look for and fix potential issues.
What data does the nano-node telemetry provide ?
The following is an example-response provided by the telemetry rpc request :
{
    "metrics": [
        {
            "block_count": "173834771",
            "cemented_count": "173834771",
            "unchecked_count": "0",
            "account_count": "30874506",
            "bandwidth_cap": "10485760",
            "peer_count": "208",
            "protocol_version": "18",
            "uptime": "9570208",
            "genesis_block": "991CF19009...AA4A6734DB9F19B728948",
            "major_version": "23",
            "minor_version": "3",
            "patch_version": "0",
            "pre_release_version": "0",
            "maker": "0",
            "timestamp": "1674466711662",
            "active_difficulty": "fffffff800000000",
            "node_id": "node_38d87w3o99k5np...nz36kui3re5",
            "signature": "745514A037472E2986DC755...370E1AF08",
            "address": "::ffff:159.XXX.XXX.206",
            "port": "7075"
        }
    ]
}
The dashboard visualizes the following metrics for each node :
- checked blocks (and missing checked blocks)
- cemented blocks (and missing cemented blocks)
- unchecked blocks
- total accounts (and missing accounts)
- bandwidth limit
- peer count
- node version
Can we identify weak nodes by looking at the telemetry data ?
Identifying the best nodes by looking at the telemetry data is not obvious.
However identifying weks nodes seems possible with the metrics provided in the telemetry.
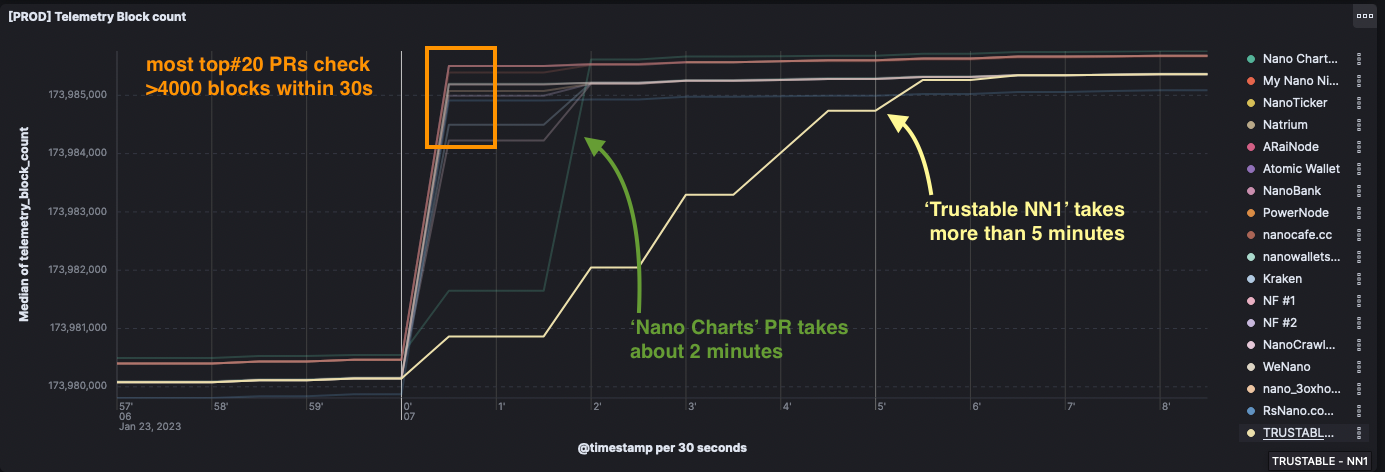
As an example, we will look at the block_count graph .

During the daily speedtest performed by nanotps.com, 5000 blocks are published to all nodes.
What we see, is that most top#20 representatives check most of the blocks within 30 seconds, while 2 nodes take considerably longer.
An even better insight can be gained from looking at the following graph that shows the missing block_count .

We see the same 2 outliners Trustable NN1 and Nano Charts. We can also see that the red line My Nano Ninjadisappears when the speedtest starts. This means that the connection to that node was lost and not telemetry data was reported. The node probably died down during the test and came back online about 4 minutes later.
Having the above in mind, we an look at how quickly nodes are able to cement the checked blocks.
A transaction is cemented by the node, as soon as it has gathered 67% of online vote weight from all online representives. It means that quorum has been reached and the transaction is final.
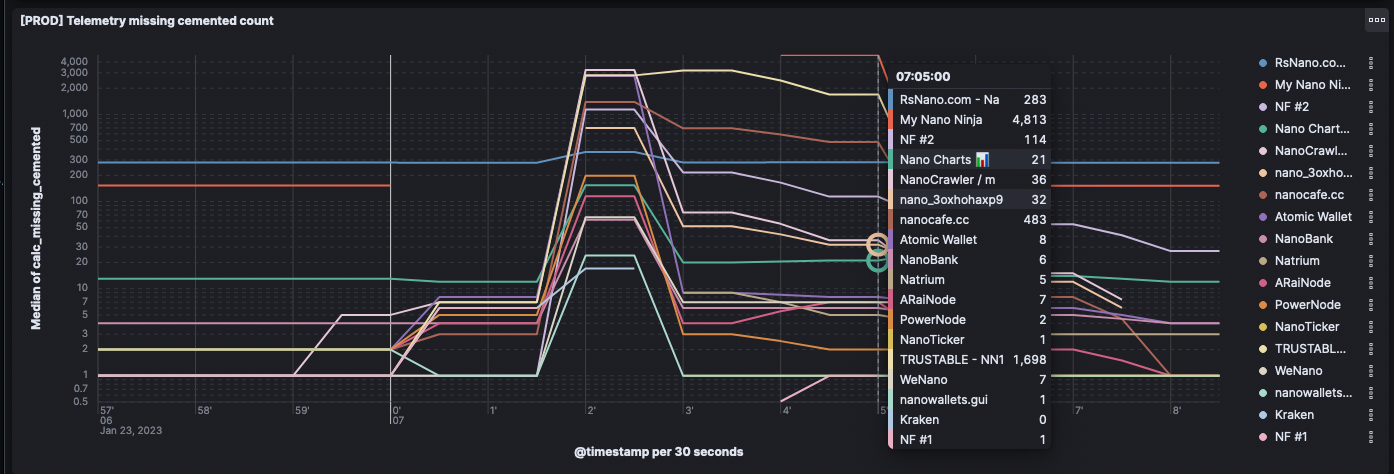
The following shows a graph of missing cemented blocks :

In the graph above, we can see that after 5 minutes, some nodes are still struggeling and have missing cemented blocks.
5 minutes after the speedtest of 5000 blocks :
My Nano Ninjarepresentative has 4813 missing cemented blocks. (It's the node that stopped reporting telemetry data at the start of the speedtest)Trustable NN1has 1698 missing cemented blocks.nanocafe.cchas 483 missing cemented blocks.Nano Chartscaught up well and has almost no (21) missing cemented blocks.RsNano.comhas 293 missing cemented blocks, but it started with this many missing blocks even before the speedtest began. So overall it coped very well.
What can be done to improve the situtaion?
In a decentralized network every user has some responsibility to make sure the network operates as intended.
- Node providers can upgrade their hardware.
- Users can change their representatives if they delegate to a weak node.
- New nano-node versions can reduce hardware ressource usage.
If you like my work, please show your love 💛